Table of Contents
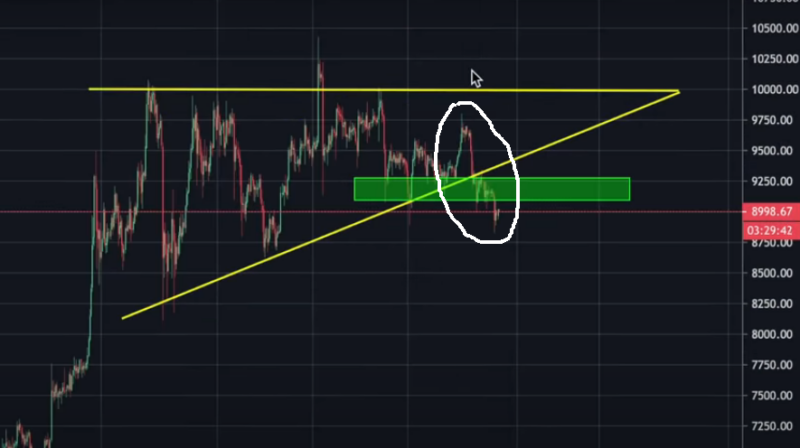
Currently, we are seeing the selling pressure on Bitcoin steadily increase and build up steam as the Bitcoin price continues to head lower. This development led to Bitcoin breaking through important support regions and leading to more weaknesses coming into the Bitcoin market.
Yesterday, we saw one of those important regions get broken as price closed below the $9,000 support region. This support as held the price on numerous occasions and the recent break as opened the way for further decline all through this week.

Levels to Watch Out for Price Support
The next important region price might find support on is the $8,000 region. This region as severed as strong support for the Bitcoin price on numerous occasions in the past and will be the first level that would come into play in this downtrend.

If this $8,400 level holds, then we might see a bounce back into the ascending triangle and maybe a retest or break of the $10,000 region.
However, if the price breaks through the $8,000 support region, the next important support region is the $7,500 price level. This level as served as both resistance and support in the past and might be a great target to watch for price to crash to and then bounce from.
A break of this price level could see Bitcoin crashing as low as $6,000 in the coming weeks.

A Bearish Head and Shoulder Pattern
Bitcoin is also currently forming a bearish head and shoulder pattern on the chart. This pattern supports the price forecast of a dump to $7,000. The pattern is also nearly completed and we might see the aggressive sell-off begin in the next 24 to 48 hours if price decides to move lower.

The target level to watch out for this head and shoulder sell-off is the $7,400 price level. This target level is gotten by measuring the distance between the head of the pattern “H” and the support baseline, the distance is then projected downward to get the target for this Bitcoin sell-off.

My Bearish Head and Shoulder Entry Criteria
It is important to note that this pattern is yet to be completed as we need a final aggressive push down in price below that neckline support region to confirm the break of price. Until that is achieved, we might see a reversal in price and a push up back above the neckline.

I am also watching the current volume closely. I want to see a steady increase in bearish volume to support the Bitcoin sell-off in the coming days.
To gain more information on how to partake in this coming Bitcoin Bear run and trade this cryptocurrency, you can read my How To Trade Bitcoin Guide and follow my daily bitcoin analysis. You can also check my top list of Best Bitcoin Exchanges To Trade With.


