Table of Contents
With the upcoming Bitcoin halving set to occur on May 11th, 2020, one of the biggest questions bitcoin traders are asking is:
- Will this event lead to a price surge in Bitcoin?
- How far will the Bitcoin price get to if the price surge occurs? and
- How can they best position their portfolio to take advantage of it?
In this Bitcoin analysis, I will be taking a critical look at the historical effects of bitcoin halving on the price chart and how it supports my overall bias on the continuation of bullish momentum in bitcoin. I will also be pointing out a few trading ideas you should be watching out for and best to position yourself for the massive price surge that might occur as the big day approaches.
Bitcoin Halving and The Effects On the Bitcoin Bullish Momentum

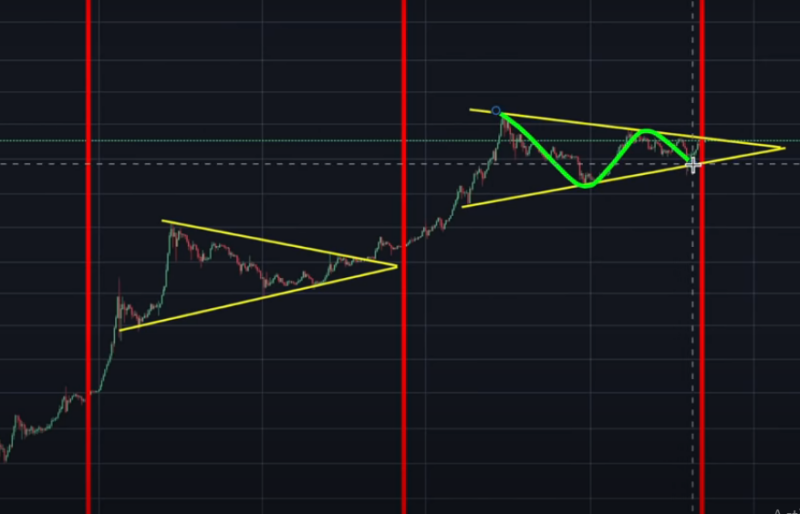
The red vertical lines are the halving’s, this occurs every 4 years and while past price movements do not guarantee future repetition, it is important to note the similarities between the current price action forming on the chart and the previous one that led to the massive bull run to the $20k region.

Before the previous halving, we did see a tightening range of support and resistance that finally broke out to a new all-time high. This breakout led to a near parabolic consistent rise in price for 88 weeks with a 4,798% gain in value.

Well, that pattern is forming again this 2020 and it is gaining my interest even as we begin the count down to the day of the halving. Following that $20k previous highs, the price has been gradually compressing forming a symmetrical triangle and waiting for a breakout.

I can also see a few similarities in the internal structure of the two patterns, with price bouncing off the highs and retesting the resistance multiple times further supporting my long term bullish bias on the Bitcoin.

What Levels Should You Be Looking at?
- Support Levels

There is a possibility that bitcoin might get weaker and fall in the coming weeks to retest the base channel of the symmetrical triangle before turning back upwards and getting a break to the upside. The important support level to watch out for is the $6,000 region which also serves as the base channel for the symmetrical triangle.
- Resistance Levels

The $10k high is the most important resistance level I am currently watching. If price breaks through this region in the coming weeks, then the bearish scenario mentioned above is completely gone and we can expect the price to continue heading higher.
- Targets

If Bitcoin were to repeat or do something similar to what we saw during the 2017 Bitcoin halving, then we might see price surge to as high as $450k in the next couple of years. However, you must remain cautious, as a break above the $20kprevious highs could see Bitcoin become very volatile and speculative.


