
Table of Contents
Today, we saw a big move on Bitcoin as the cryptocurrency had more than a 5% pump in price. This pump came as a result of Bitcoin completely rejecting the $8,900 support region and bouncing off from it.

I talked about the importance of this support region in my previous Bitcoin analysis “Bitcoin Declining Volume and The Coming 1000% Price Surge” and how it holding strong and not allowing price to breakthrough can push bitcoin back into the $9,000 or $10,000 resistance region.
Well, does this mean Bitcoin is completely out of the bear territory and how can we take advantage of this bullish move on Bitcoin?
Bitcoin Offering Short Term Scalps

While Bitcoin is still in a ranging market, it is important to understand that the cryptocurrency offers traders lots of opportunities to scalp trades and make money by trading short term trends on the lower timeframe.
And in this Bitcoin analysis, I will be analyzing one such bullish scalp trade that is currently developing on the Bitcoin chart.
The Neckline Break

Bitcoin is currently trading in a falling wedge, however within this fallen wedge, the cryptocurrency is currently forming an inverse head and shoulder pattern, I talked about this bullish pattern and the importance of the neckline break in a previous Bitcoin analysis “Bitcoin Bounces Off The $8,900 Support Region. Buy Now?”
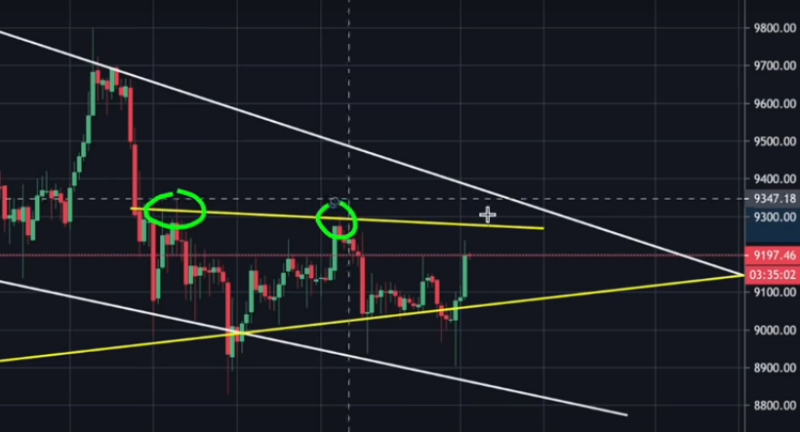
Well, that neckline is coming into play again today as the price is currently pushing up towards that level.
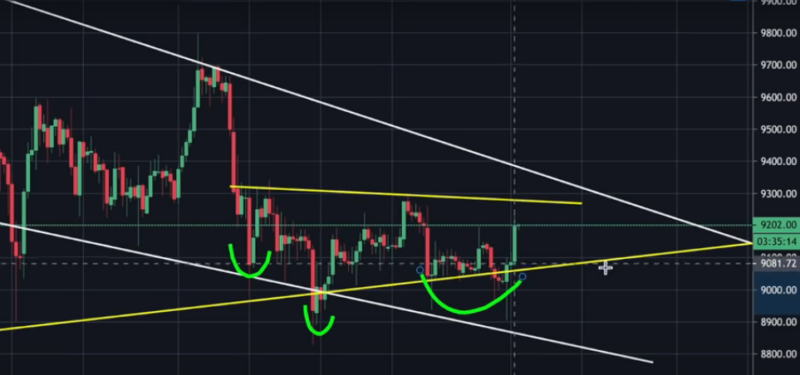
The break of the neckline could see the bitcoin price remaining very bullish and heading higher in the next few days or weeks. However, a rejection at this important resistance could send prices back down to test the $8,900 support region or lower.
Price Targets And Levels TO Watch
There are three main targets and resistance levels to watch out for once the neckline of the inverse head and shoulder pattern is broken.
- The Top Of The Falling Wedge Channel

This top channel as served as a price barrier on numerous occasions in the past and might do so again for this coming bullish move. For this reason, the channel is my first resistance level I will be looking at to see how the price reacts with it in the coming days.
- The Head and Shoulder Pattern Target

My next target level for this bullish move is the traditional head and shoulder target level.
And my target for this bullish move is $9,700. The Bitcoin price also found strong resistance at this price level in the past, making it an important region to watch out for a price rejection.
- The Top Of The Rising Triangle

Once the Bitcoin price breaks through all the previously stated resistance, the next likely resistance will be the top channel of the rising triangle Bitcoin has been trading in for weeks now.
Bitcoin rise to this region will see price testing the $10,000 region again and might see a rejection ora breakthrough from it.
To gain more information on how to partake in this coming Bitcoin Bull run and trade this cryptocurrency, you can read my How To Trade Bitcoin Guide. You can also check my top list of Best Bitcoin Exchanges To Trade With.


