Table of Contents

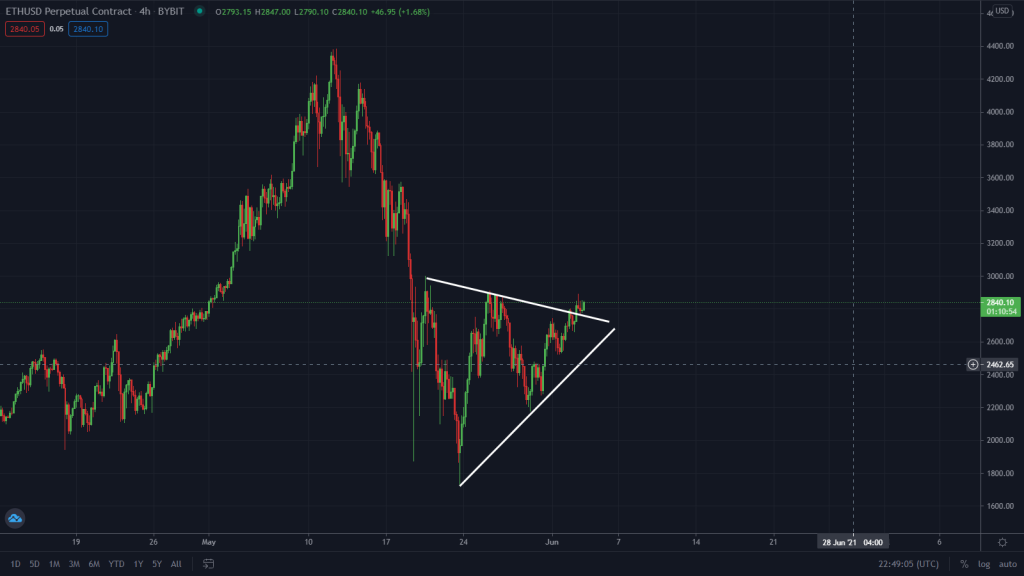
Ethereum is currently breaking out from the flag pattern it has been trading in all week! Is this a clear indication that the bull trend has resumed for Ethereum or is this just a fakeout?
In this Ethereum analysis, we will be talking about the bullish potential for the Ethereum price chart, key levels to watch, and the likely target for a bullish surge.
Margin traders can trade Bitcoin and Ethereum with up to 100x leverage on ByBit. Use this link to sign up and earn a free bonus on your initial deposit.
Key Levels To Watch

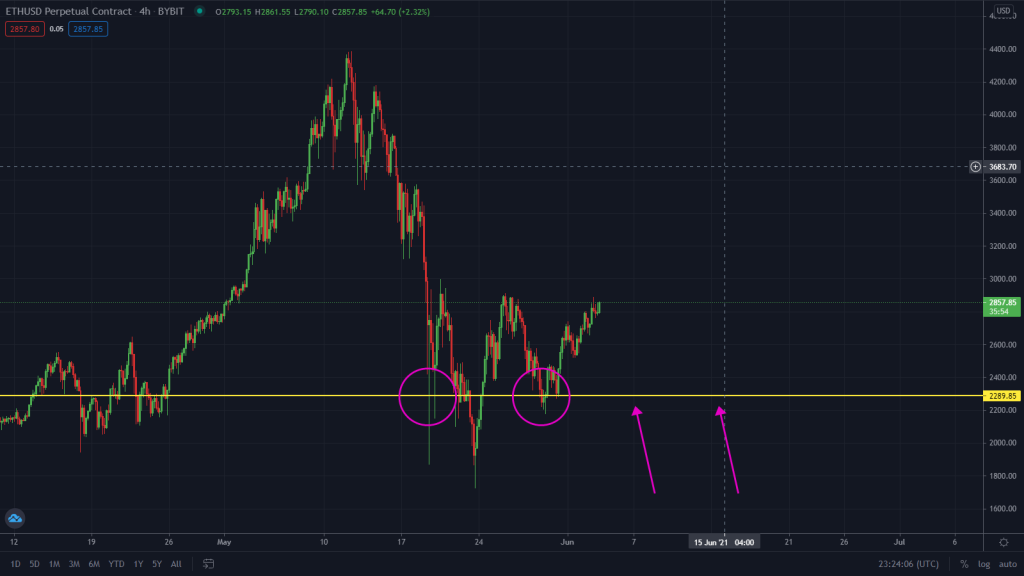
In our previous Ethereum analysis ETH About To Dump! Are You Still Buying?, we made a bearish prediction for the Ethereum price, pointing out the $2,289 support level as the key level to watch for an entry to the downside.
That bearish bearish prediction was never triggered as Ethereum price continued to rally all week. Right now, the Altcoin price is currently breaking through the flag pattern currently playing out on the Ethereum 4-hour chart.

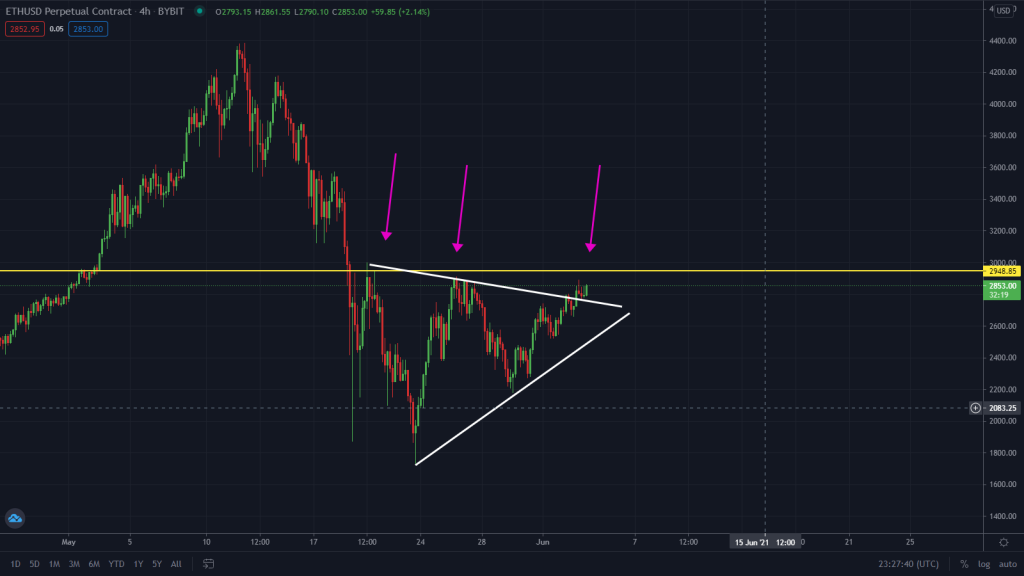
However, for this bullish move to be confirmed we need to see the Ethereum price break and close above the $2,948 horizontal resistance on the 4-hour timeframe.
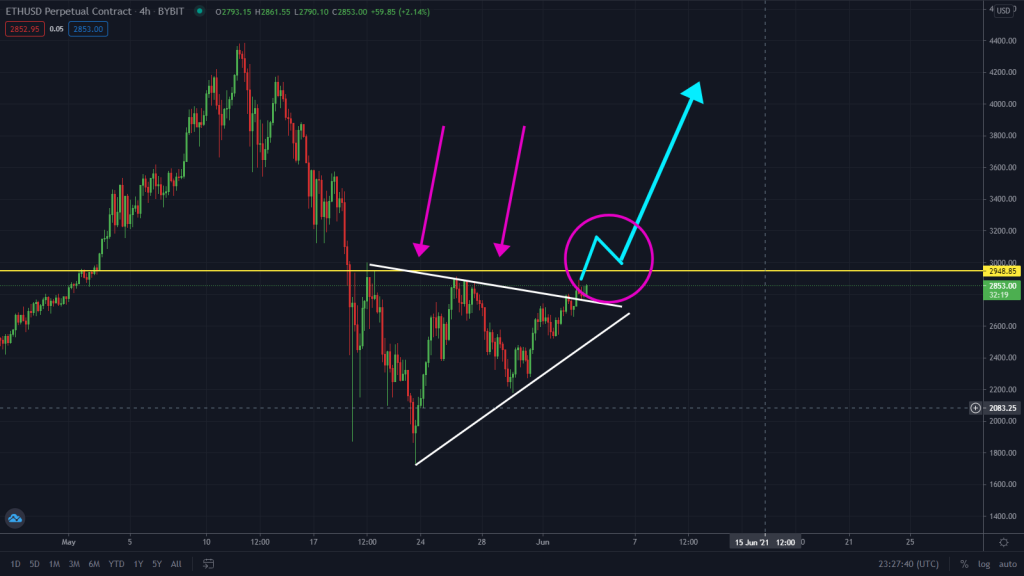
A break of this resistance is confirmation of our bullish bias on the Ethereum price.

But until this resistance level is broken, there is a very high probability that this current breakout might turn out to be a fakeout and we might see a dump.
Bullish Targets

A break of the $2,948 horizontal resistance could potentially see Ethereum surging to as high as $3,929 in the coming days. This could potentially be the confirmation we need to the bias that the Ethereum bearish trend might finally be over.
However, if Ethereum is unable to break through this $2,948 horizontal resistance, there is still a high probability that Ethereum might just crash back down in the coming days
Final Verdict
We are remaining neutral on the Ethereum price until the Altcoin breaks and closes above the $2,948 resistance. Only then can we start looking to enter a buy trade for Ethereum expecting the price to keep heading higher in the coming days.
More Trading Ideas
Easy Steps From Beginner To Pro Crypto Trader
You can speed up your learning journey by reading our How To Trade Bitcoin Guide. This guide is the best for crypto traders who wants to get familiar with the basics of Bitcoin trading. You can also check out our top list of Best Bitcoin Exchanges To Trade With.
Hassle-Free Trading
Tired of the hassle that comes with technical analysis? If so, PrimeXBT Covesting allows you to mimic experienced traders. Sign up with our link today.


