

Candlesticks have become a classic way to display market data in just a few decades, and this has not happened by accident. They carry additional information, and as a result, they allow us to see patterns, many of which cannot be traced on line charts.
However, to take advantage of candlesticks, you need to understand how to read candlestick charts, and find the most important candlestick formations. Get candlestick charting explained, learn the best candlestick signals for beginners, and build your candlestick trading strategy.
Candlestick Patterns for Beginners – What Are Candlesticks?
Let’s start with the basics – candlesticks are one of the ways to display the asset price dynamics on financial charts. One of the versions says that its origins are from the Japanese rice exchange market, which operated since the 17th century. Homma Munehisa, a Japanese rice trader and monetary businessman, invented candlesticks to conveniently display market data and work on this market more effectively. However, during that time, he found that prices were very dependent on traders’ sentiment, and his candlesticks proved to be highly productive in identifying its patterns and predicting further price movements. Time and assets changed, but it turned out that candlesticks are also versatile, so over time, they have been successfully used to find stock market candlestick patterns and now crypto candlestick patterns.
Alternatively, the West had its own ways of displaying market data, such as Bars. These are still often used today and are equally informative, but candlesticks gained their popularity in the Western world in the 20th century due to their clarity and usability.
How Are Candlesticks Structured?
Let’s look at the basics of what components a candlestick consists of and what parameters it has, understanding which information it brings.

Candlestick body
The area between the opening and closing prices during a trading session (minute, hour, day, etc.) is called the body, and its color indicates whether the candlestick body is bullish or bearish. If the opening price is below the closing price, the body color is green, and if the opening price is above the closing price, the body color is red.
Talking about best candlestick signals for beginners – it is important to learn very basic principles, such as whether the trend is up or down within the selected session, which can be indicated by the length of the candlestick body. Namely, the longer the green body, the greater the buyer’s pressure or optimism. Also, the longer the red body, the greater the seller’s pressure or fear.
Candlestick Shadow (or Wick)
The candlestick shadow is the line at the top and bottom of the candlestick body, called the upper and lower shadow, and shows the maximum and minimum price during the trading session. The length of the shadow also carries some information when talking about the best candlestick signals for beginners.
For example, if the upper shadow is relatively long, it can mean that the price was rising and at the peak faced pressure and was later dominated by sellers, and vice versa if the upper shadow is short then buyers remained dominant throughout the session.
Now that you know the basic components and indicators of candlesticks, you can move on to the most important candlestick formations and break down bullish and bearish candlestick patterns.
Bullish and Bearish Candlestick Patterns
Trading with candlestick patterns, both bullish and bearish, can be divided into basic candlestick patterns for beginners and top candlestick patterns for more experienced traders.
Basic candlestick patterns are relatively easy to detect and work well on their own, while top ones are sometimes more complex and are worth using additional indicators for greater accuracy.
However, this division is partly dependent, and any of them can be complemented by additional indicators, while each trader could more easily find one or another of patterns solely for individual reasons.
The most important thing is that no basic or top pattern guarantees exact price movement because the markets are constantly influenced by enormous extra factors that any single pattern can not capture fully. But still, those candlestick patterns on top of grounded candlestick trading strategy and understanding the market dynamics and industry trends as a whole – can work very impressively.
Beginner Trading Patterns
Hammer and Inverted Hammer (Bullish Pattern)
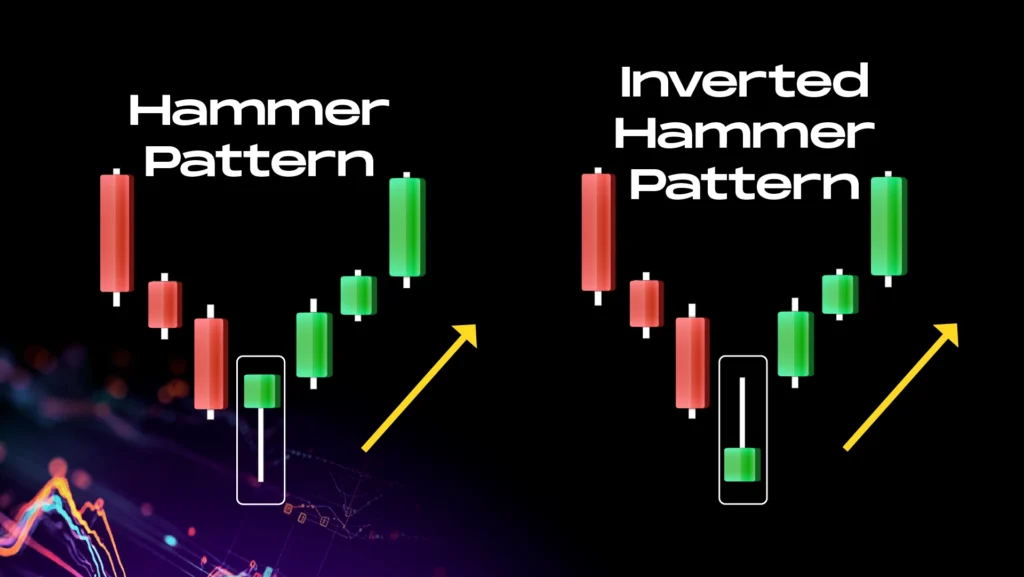
Hammer is one of the classic and popular bullish candlestick patterns that can signal that sellers are losing strength and a bullish reversal is possible. This pattern is more accurate when the candle is at the bottom of a downtrend, and the lower shadow must be higher in height than the candle body for the pattern to be valid. The Inverted Hammer, although inverted, remains a bullish one and also signals a possible bullish reversal, indicating the end of the downtrend.
For precision, especially for beginners, it is better to wait for a confirming bullish candle after the hammer, and traders of all levels should combine it with support levels and volume indicators like CMF for better accuracy.
The Hammer and Inverted Hammer can be good for beginners because they are relatively easy to recognize visually, they give a clear buy signal after a downtrend, and fairly high probability of success when formed at key support levels.
Pin Bar (Bullish and Bearish Pattern)
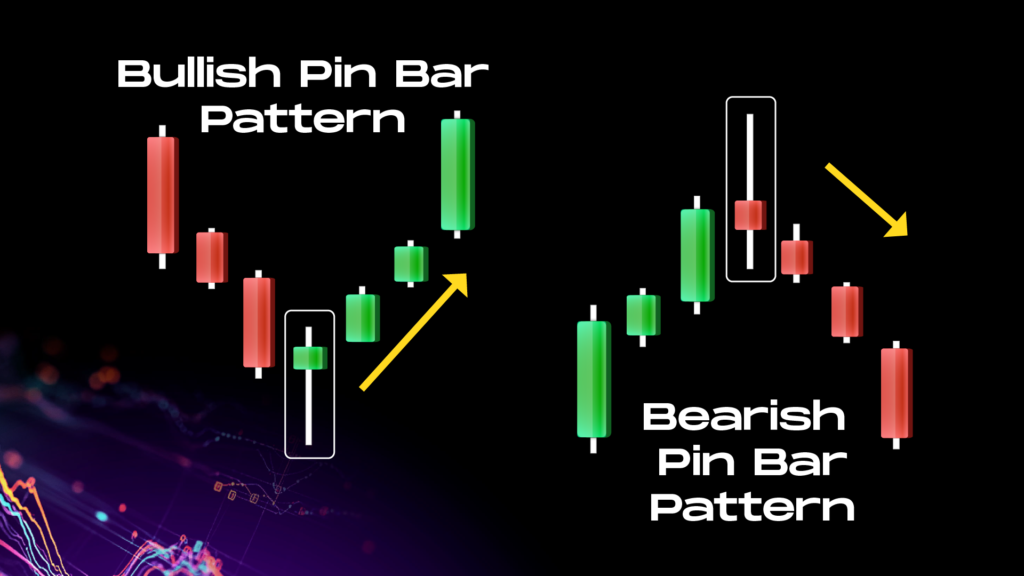
Pin Bar is probably one of the most, if not the most popular reversal patterns, which is used to identify possible reversals or trend continuation after a pullback.
Bullish Pin Bar looks like a candle with a long lower shadow, a small body, and a relatively short shadow on the other side, while the lower shadow should be at least two-thirds of the entire candle length. A bearish pin bar looks the opposite, with a long upper shadow, a small body, and a short lower shadow.
Also, its accuracy can be noticeably higher when it forms around key support and resistance levels and moving averages.
This is also one of the best candlestick signals for beginners, as it is also quite easy to find, and it combines well with support/resistance levels and moving averages, which can add reliability important for beginners.
Engulfing (Bullish and Bearish Pattern)
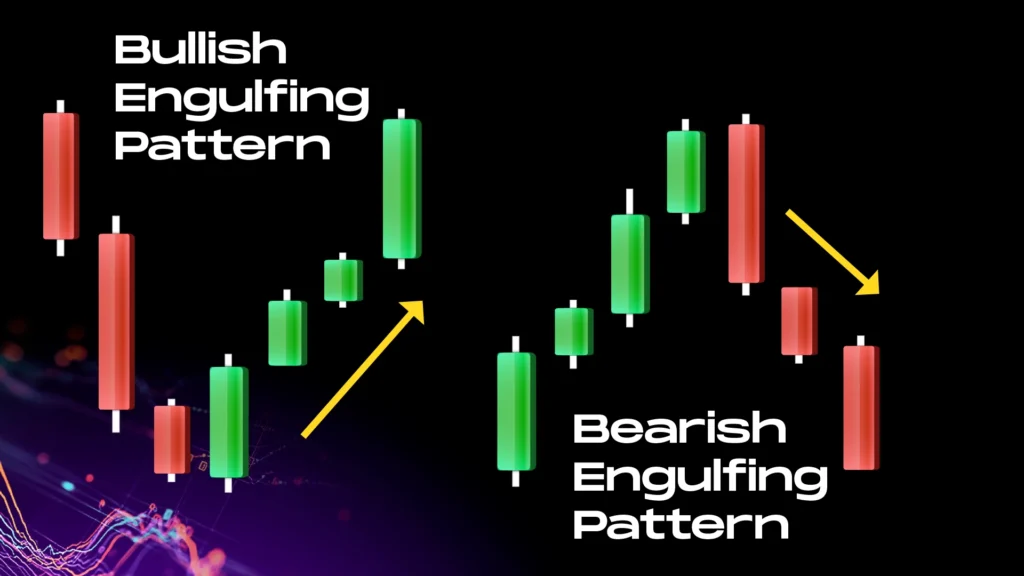
Another very popular pattern that may seem quite simple but remains highly effective in identifying a reversal or trend continuation.
The Bullish Engulfing pattern looks like a red and green candle, whereas the green one has very little or no overlapping shadows, indicating that the buyers are dominating. Importantly, the green candle should open below the close of the previous candle and close above the high of the previous candle.
Bearish Engulfing pattern, as you can guess, looks exactly the opposite and indicates that the dominance goes to the sellers, indicating a possible price decline.
The value for beginners here is that this is also a rather easily recognizable visual pattern, which is quite intuitively clear and gives a fairly straightforward logic – bullish engulfing = buy signal, bearish engulfing = sell signal.
To use it more thoroughly, you should enter the trade after the second candle closes and it will be great to strengthen the signals with volume indicators (for example, with CMF growth).
Harami (Bullish and Bearish Pattern)

Harami may seem similar to the previous pattern, and it indicates a reversal trend too, but it has some differences. Harami is two consecutive candles, where the first candle has a long body and small shadows, and the second candle is a small candle with a body completely inside the body of the previous one.
In an uptrend, the first candle is green, while the second one is red, offering to sell, and vice versa when downtrend, the first candle is red, and the second one is green, offering a potentially good buying opportunity.
It is worth noting that this pattern may not be as obvious as the previous one, but it is still suitable for beginners because it most often occurs at the end of trends, consists of only two candles, does not require additional indicators, and offers a simple entry strategy – if the price goes beyond the first candle, the trend is confirmed. However, this can be reinforced with additional indicators such as ADX.
Doji
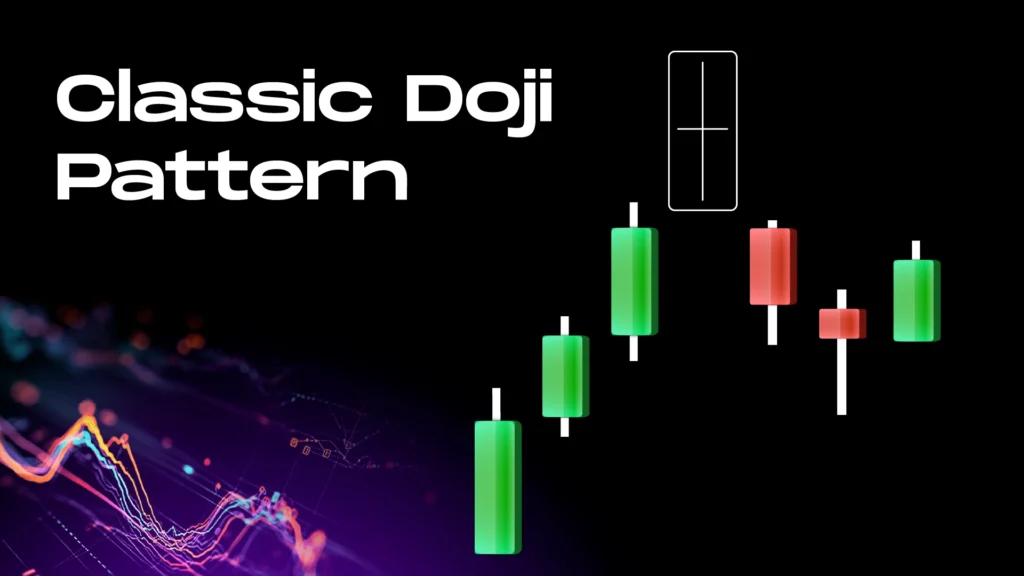
Last but not least is Doji, the popularity of which cannot be overestimated. Here, we will come to the classic Doji, but it has several additional versions with their own peculiarities, and this pattern is so versatile that we will reserve a separate topic to it in the future.
It looks like a candlestick that opening and closing prices are more or less the same, while the length of the upper and lower shadows can vary. This means that the dominance is not with either buyers or sellers, and you should be cautious and wait for further confirmation or additional information.
Doji is good for beginners because it is like that responsible friend who won’t let you make bad decisions—just like the one who hides your car keys after a few beers. So it indicates uncertainty and insecurity in the market and suggests not to enter the deal and wait for confirmation. To get more information you can combine this with support and resistance levels, and for slightly more experienced traders this pattern combines well with others like Pin Bar and Engulfing.
Top Candlestick Patterns
Let’s move on to the slightly more complex but powerful candlestick patterns, which consist of more candles, appear less frequently, and require the use of additional indicators.
Three Outside Up (Bullish Pattern)

A rather powerful reversal pattern starts with a small bearish candlestick, then a large bullish candlestick that completely engulfs the first one, signaling a change of control in the market, and a third bullish candlestick that closes even higher, confirming the reversal.
This pattern can be seen at key support levels, so they should be watched carefully, and it is additionally confirmed by a noticeable increase in volume. It is advisable to wait for the third candle to confirm the pattern and not to enter before then.
Dark Cloud Cover (Bearish Pattern)
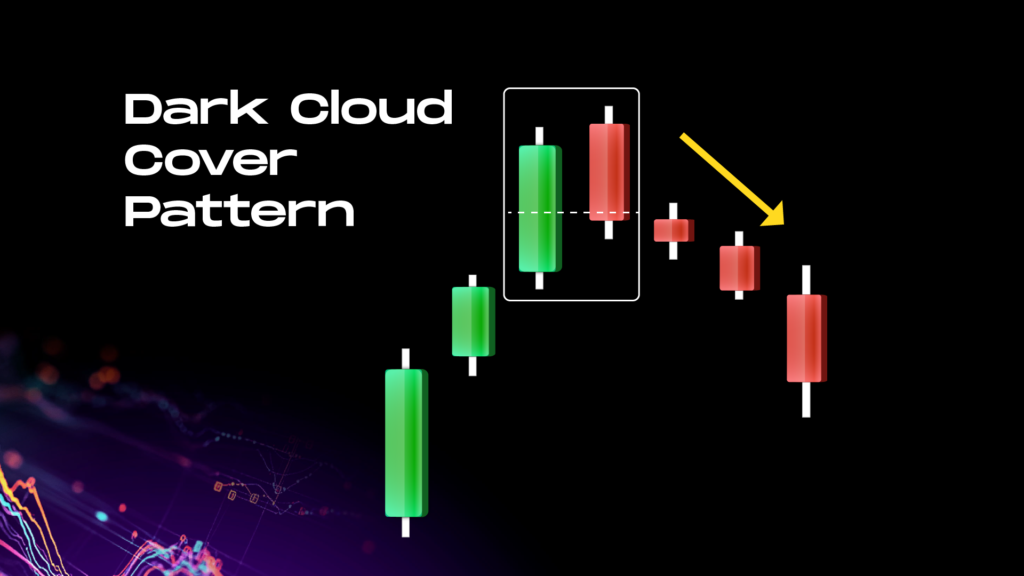
This is the opposite pattern, which signals the weakening of the uptrend and, with a high probability, signifies a powerful bearish reversal. Dark Cloud Cover consists of two candles – the first is a long green one followed by a long red one that opens above the close of the previous.
It should be used with other indicators, especially RSI and MACD to confirm a reversal.
Three White Soldiers and Three Black Crows (Bullish and Bearish Pattern)
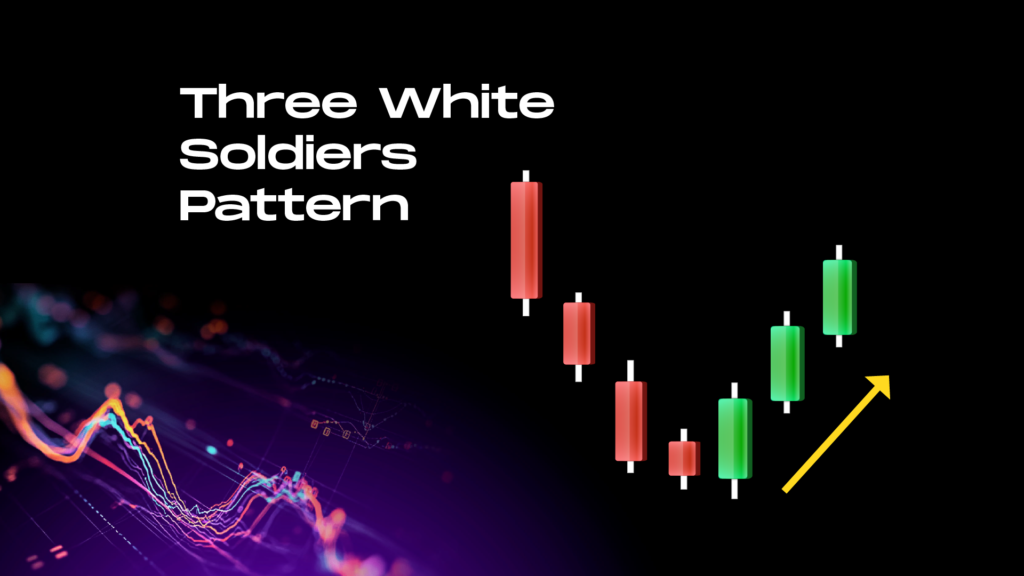
Three White Soldiers is a prominent bullish reversal pattern of three candles with small shadows, where each candle should open near the closing price of the previous candle. This pattern shows itself particularly well on a downtrend that has been developing for a long time and can signal the probable opening of long positions.
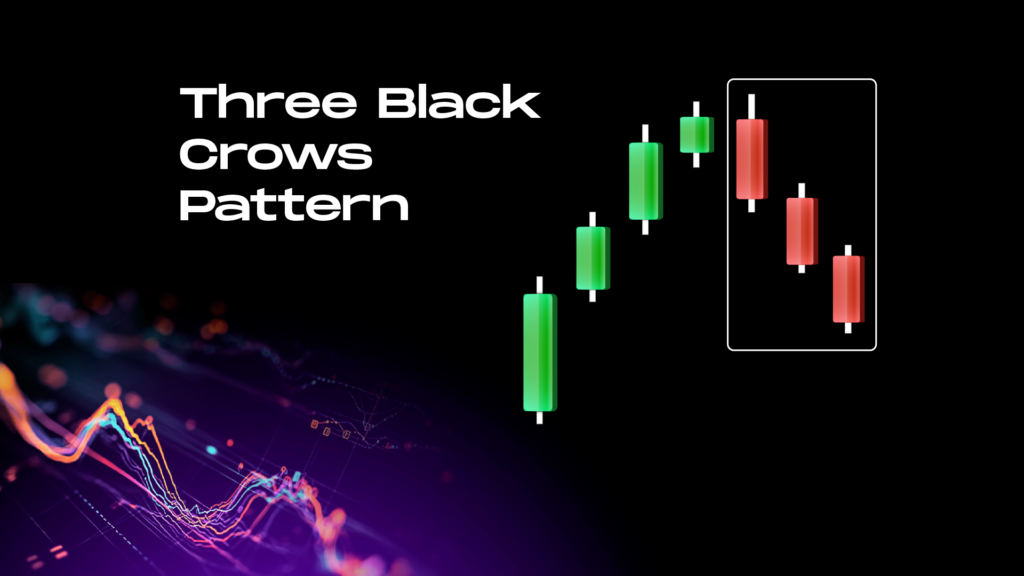
A similar but Bearish Pattern is the Three Black Crows, which is formed by three consecutive bearish candles with each closing price below the opening price and is particularly effective on an uptrend after a mature rise.
It is a pretty strong and reliable pattern that shows the trend strength and signals its possible continuation, especially when combined with volumes. But, it has some peculiarities, for example, you need to watch out for resistance/support levels and also consider risks like bull traps.
Morning and Evening Star (Bullish and Bearish Pattern)
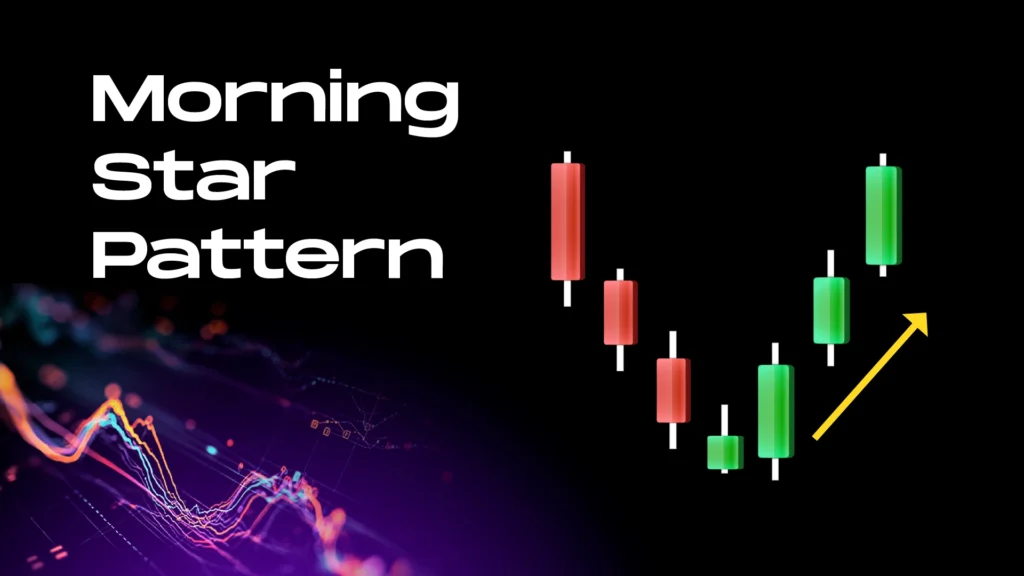
Morning Star is a Bullish Pattern that implies a bullish market condition and predicts a likely powerful reversal after corrections. It consists of three candles, namely the first is bearish with relatively small shadows, the second is formed at the bottom of the first candle and has a small green or red body and short shadows, and the third bullish candle is at least the same size as the first candle or larger, indicating strong buying pressure and a potential trend reversal.
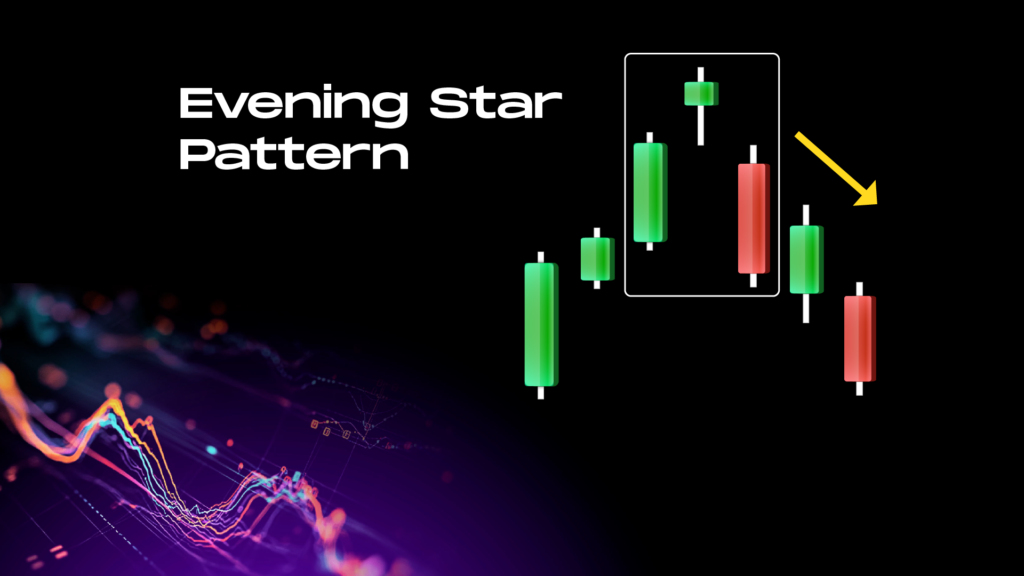
The Evening Star works quite similarly, only it looks inverted, implies a bearish condition, and indicates a bearish reversal.
Its notable advantage is that it works well on any timeframe and generally performs well over the long term. To confirm, it is worth using additional indicators like volume change, as well as using Fibonacci levels and RSI for more accuracy.
How Legends Community Helps Traders Filter and Optimize Candlestick Setups?
Knowing candlestick patterns is one thing, but being able to use them in real market conditions is quite another. Many traders face a situation when a “perfect” setup does not work as expected. Why? Because patterns alone do not give a complete picture of the market. They only work if you consider the context, including volume, liquidity levels, and market structure.
Here’s a classic example: the Engulfing pattern. It would seem to be a powerful reversal signal. But if it occurs within a consolidation or without volume confirmation, its probability decreases sharply. Or, for example, the Pin Bar is a good indicator of a pullback, but its strength highly depends on the level at which it was formed.
This is where Legends Community comes in – a professional trading space that helps everyone bridge the gap between textbook patterns and real market execution. Instead of blindly guessing, members learn how to combine candlestick formations with advanced confirmation tools, including:
- Order Flow & Liquidity Mapping. Understanding how large market participants interact with key levels and how this affects the probability of pattern validation.
- Volume & Delta Analysis. Using Volume Weighted Average Price (VWAP), Footprint Charts, and Open Interest data to see whether the market truly supports a given pattern.
- High-Precision Support & Resistance Levels. Recognizing which key levels have actual institutional liquidity backing them and which are weak and easily manipulated.
- Advanced Trading Strategies. Integrating SFP (Swing Failure Pattern) setups, aggressive liquidity grabs, and delta absorption strategies with candlestick formations.
Live Trade Breakdown & Real-Time Market Analysis
Beyond theory, Legends Community provides real-time trade breakdowns, helping traders:
- Learn how professional traders evaluate signals in different market conditions.
- See why some classic setups fail when volume and liquidity data contradict the pattern’s signal.
- Get direct access to pre-planned trading setups, where candles are only one piece of a bigger confluence model that includes order book dynamics, delta trends, and liquidity imbalances.
From Theory to Execution!
So, technical analysis isn’t just about recognizing patterns – it’s about understanding market behavior behind those patterns. By adding volume profiling, delta shifts, liquidity mapping, and institutional order flow tracking, traders can move beyond basic setups and start making decisions based on real market data.
Stop trading based on isolated patterns and start analyzing full market conditions, making your research more comprehensive and your decisions more profound. Join Legends Community and get more insights for your trading in 2025!
Conclusion
Of course, there are more patterns, and in addition to them, indicators in combination with which they are used, that deserve a separate breakdown, which we will do later. However, here we have analyzed the classics, which have been used for many years by millions of traders, and show impressive results with the right approach.
But as always, remember that they are just tools, and they are not the ones making the decisions, nor are they responsible for them. It’s up to you to learn the industry, which will directly impact the effectiveness of using these tools, as well as avoiding key mistakes and managing risk well.
It is good that top platforms provide a Demo Trading feature where you try out your new knowledge and hone your skills on a real interface but without risking real money. For example, one of such feature-rich and safe platforms is WEEX, certified to operate in the USA and Canada. Learn its detailed review here. Here’s a great offer if you’re planning to deposit on WEEX! They’re giving away a 50% deposit bonus, with a maximum of 1,000 USDT. Perfect if you’re looking to add more funds to your trading account!
Disclaimer: The information provided in this article is for informational and educational purposes only and does not constitute financial, investment, or trading advice. Any actions you take based on the information provided are solely at your own risk. We are not responsible for any financial losses, damages, or consequences resulting from your use of this content. Always conduct your own research and consult a qualified financial advisor before making any investment decisions. Read more


