

There are few things more exciting and anxiety-inducing than riding a trend. However, have you ever asked yourself if you should continue with your position or liquidate it before the trend reverts? Or even, how to identify the very start of the next trend so one can maximize their profits? Fortunately, with a little bit of knowledge on the Break of Structure in Trading, we can get into these types of positions and potentially see excellent returns.
What is Break of Structure (BoS)?
The break of structure is a specific chart pattern that gives us further insight into how a trend will likely behave in the short future. Being able to recognize this structure allows investors to maximize profits, as they are largely considered great entry points for trend riding.
Healthy assets generally don’t trade only upward or downward movements all the time, no matter how much momentum the asset may have, there will always be recurring price corrections. Even in strong bullish trends, you’ll almost never see a cryptocurrency with only green candlesticks for a longer period on timeframes of less than a day.
For this reason, a trend consists of steady ladder-like price movements. To recognize a bullish trend you gotta look for higher highs and higher lows. The same is true for bearish trends as you’ll look for lower lows and lower highs.
The Break of Structure is the point at which an asset “breaks” above or below the previous mark—signaling the continuation of a trend.
Break of Structure for Beginners
The BoS patterns may seem difficult to understand at first. To identify them you gotta track the asset’s highs and lows on a given timeframe, and understand that when it reaches higher highs and higher lows (for bullish and the other way around for bearish), you’ll stumble upon a Break of Structure pattern.
Break of Structure in Forex and Crypto Trading
The BoS is one of the most important patterns for crypto and forex traders as it gives them a lot of insights regarding the current state of the market. Using this technical analysis knowledge allows investors more opportunities to jump on a trend and potentially profit a lot while they’re at it.
How to Identify Break of Structure
Understanding BoS in technical analysis is relatively simple if you know what to look for. To make things easier, let’s look at some images. Here is the 1-hour chart for Bitcoin on December 15, 2024:
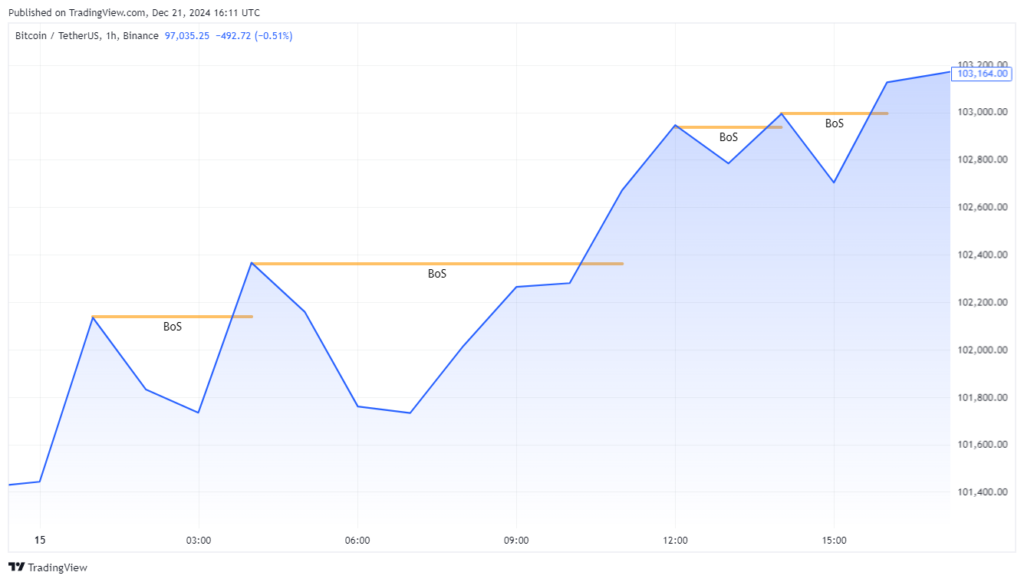
Prior to this image, Bitcoin had been trading sideways for the past day. After the charts showed several BoS structures—several times reaching higher highs and higher lows—this allowed investors to notice how buying pressure was increasing, which could result in a surge in value very soon.
In other words, when the asset surpassed the previous high, it “broke” the previous trading structure, indicating that the next price movements were likely to keep its forward momentum.
Here is how the chart looks like moving forward a day (December 16):

BoS Trading Patterns Explained
Shortly after the example above, this specific Bitcoin rally started showing signs of exhaustion by forming a bearish break of structure patterns.
On December 17th, 2024—Bitcoin’s rally seen in the past examples fatigued. But how could investors verify that the trend was likely ending in real-time? Well, once again the chart showed us a BoS, but this time indicating that the market was about to turn bearish.
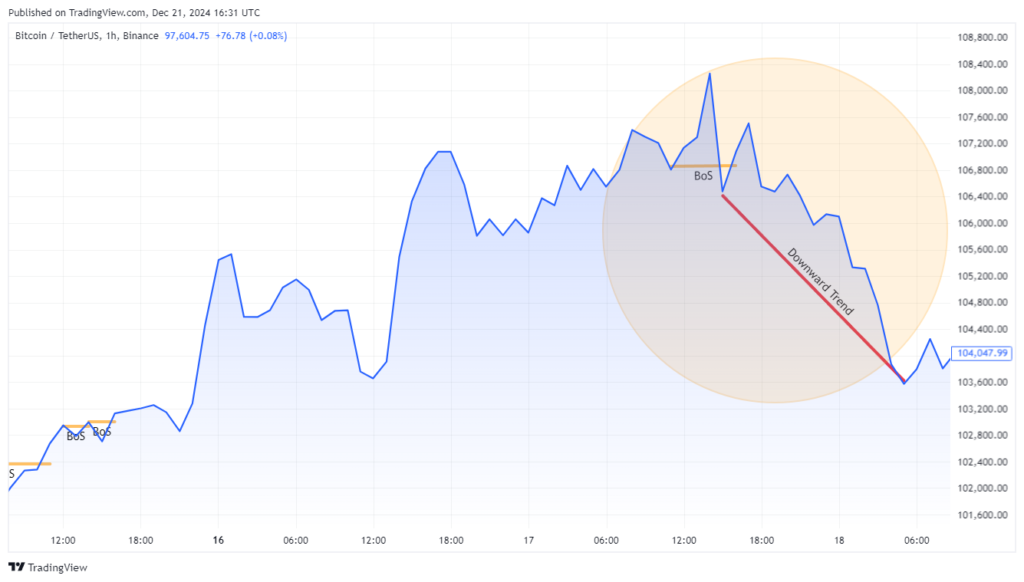
As you can see, at around 2:00 PM of that day, BTC reached a lower low than the previous. This price movement formed a clear bearish BoS, not only allowing investors to exit their previous positions but also allowing new traders to short the asset and potentially profit.
Break of Structure Trading Strategy
By analyzing BoS patterns in charts, investors can analyze the strength of a trend, and potentially capitalize on entering a position at the most optimal time possible.
To maximize your potential, also keep an eye on relevant resistance and support zones, and of course keep a close eye on the news. After all, no technical analysis tool or technique is bulletproof, and in a volatile market trends can end or being in a glimpse.
For instance, if you notice a clear bearish BoS pattern on an asset that has been on a long upward trend just as the said asset is nearing a key resistance line, this could prove worthwhile for a short position as these patterns point to a bearish reversal coming soon.
Or else, let’s say you’re keeping track of Dogecoin and Elon Musk just tweeted literally anything that closely resembles a dog. At the same time, if you notice a bullish BoS pattern on DOGE charts, it may be time to stock up on some dogecoin.
BoS Trading Signals and Confirmations
Here are a couple of confirming signs that the BoS pattern will go the way you’re expecting. Of course, this is not financial advice. Want some advice? Drink more water.
- Higher Highs and Higher Lows (Bullish BoS): The downtrend is showing signs of fatigue and you notice that the previous highs and lows are getting higher in price.
- Lower Highs and Lower Lows (Bearish BoS): The uptrend is fatiguing, and you see lower highs and lower lows on the charts.
- Volume Confirmation: The BoS pattern coincides with a spike in trading volume, meaning that the trend reversal is becoming more likely.
- Chart Patterns: The BoS coincides with other price action chart patterns like double bottoms or shoulder-head-shoulder. You can learn more about those here.
- Support and Resistance Levels: A BoS often occurs when the price breaks through key support or resistance levels.
Break of Structure vs Change of Character
Unfortunately, life is not as simple as looking at charts and waiting for BoS structures to appear. When a BoS doesn’t signal a trend reversal—we call this a Change of Character (CHoCH).
The CHoCH happens when a trending asset, let’s say bullish, reaches a lower low. But in this example, the trend doesn’t change directions, and right after the lower low, it continues its ascending movements.
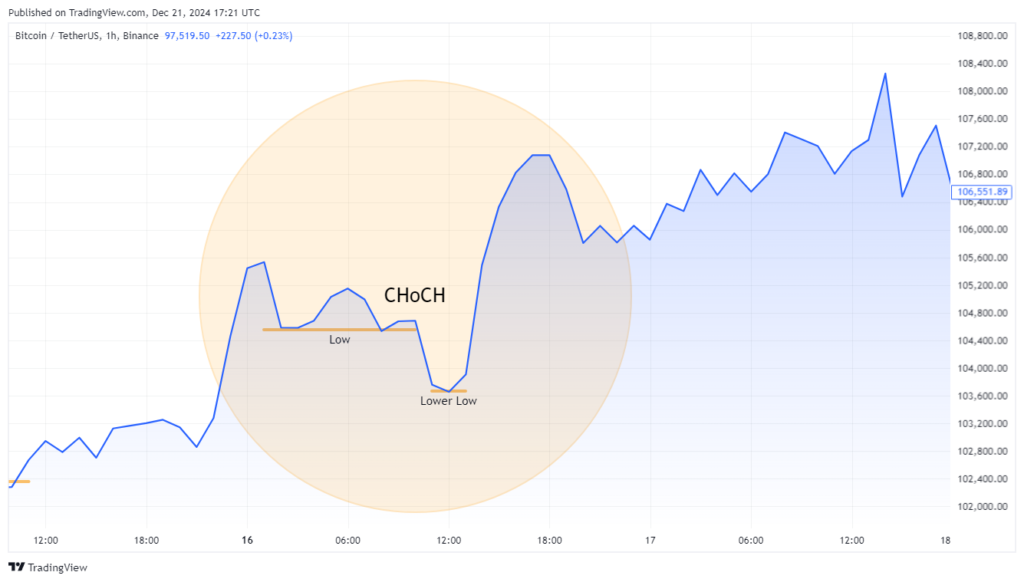
In the same example seen previously in this article, on December 16 Bitcoin saw a significantly lower low—but it didn’t result in a trend reversal as shortly thereafter the asset continued climbing.
There are a couple of ways we can analyze the structure of these patterns to help us get a better sense of whether a trend is reversing or continuing its momentum. The most important step is to check if the uptrend is consistently making higher highs and higher lows throughout.
Also, keep an eye on volume during the trend, and make sure you notice volume spikes near one of these patterns.
Keeping an eye on technical indicator patterns like support/resistance levels is also important as CHoCH becomes more common when an asset is expected to reach opposition at a given key zone.
Conclusion
In conclusion, while trading has many facets, the Break of Structure is undeniably a cornerstone. By harnessing its power and integrating it with other trading principles, traders can navigate the markets with heightened foresight, making the journey not just about trade but also about mastering the art. Embrace BoS, and elevate your trading voyage!
Disclaimer: The information provided in this article is for informational and educational purposes only and does not constitute financial, investment, or trading advice. Any actions you take based on the information provided are solely at your own risk. We are not responsible for any financial losses, damages, or consequences resulting from your use of this content. Always conduct your own research and consult a qualified financial advisor before making any investment decisions. Read more


