Table of Contents
Yesterday, bitcoin showed massive volatility with a very aggressive breakout of the symmetrical triangle pattern price has been trading in for the past few weeks. However, this aggressive upside move was immediately followed by an exceptionally unnatural move to the downside, leading to about a 10% drop in the value of Bitcoin in just 5 minutes.

This violent move to the downside has been termed as “bitcoin price manipulation” by a lot of traders in the crypto community. And while this might be true, my Bitcoin analysis for today will be focusing on the technical patterns that are currently developing on the chart due to these price moves.
Taking A Look at The Bigger Picture
While the 5-minute timeframe tells a story of gloom and doom, the higher timeframe on the other hand shows something entirely different to traders.
On the higher timeframe, price is currently only showing signs of a pullback, forming a higher low and supporting the bullish trend continuation for Bitcoin.

But for that bullish move to be confirmed, prices must first breakthrough that super strong resistance area of around 10000 I mentioned in my Bitcoin analysis earlier this week. This $10k resistance is a very important psychological level bitcoin as found very difficult to breakthrough from in the past. Prices also bounced off this level and turned bearish on multiple occasions.

What Should You Do Next?
I believe the best option for me is to be patient and not take any aggressive short or long position here until the price action is confirmed and I can find high probability trade setups.
The important level to be looking out for to support a further continuation to the upside is the 8,686 price level which also served as the base support for the symmetrical triangle. If this level gets broken, then we might see bitcoin sell-off to as low as $6,000.

It is also important that traders keep in mind that the whole structure and unnatural movement to the downside could all be a big bear-trap before prices resume moving back higher. For this reason, I will remain bullish or neutral if price trades in that $10,300 – $8,686 range. If the support gets broken, then we might see an even stronger impulse downwards. If it holds, we might see another breakout attempt.

Bearish Divergence
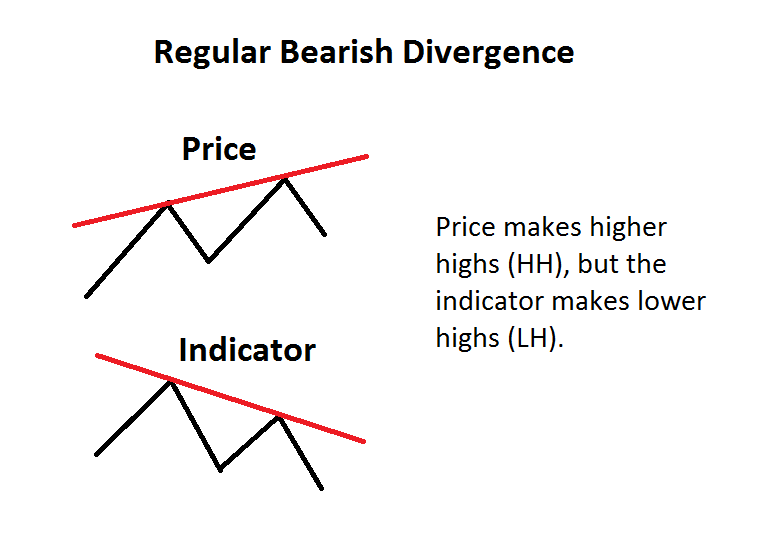
It is also important to draw your attention to the recently confirmed bearish divergence on the bitcoin charts and the potential it as on affecting my bullish outlook on the cryptocurrency.

How Does It Work?

The bearish divergence is an important confirmation that shows price weakness. In this case, the price makes a higher high while the momentum indicator makes a lower high. However, even with this price divergence confirmation, my outlook for the bitcoin market is still very bullish and will remain so until the 8,686 level gives way. Only then can I start considering a medium-term shorting opportunity after which price is likely to resume moving upward again.


