Table of Contents
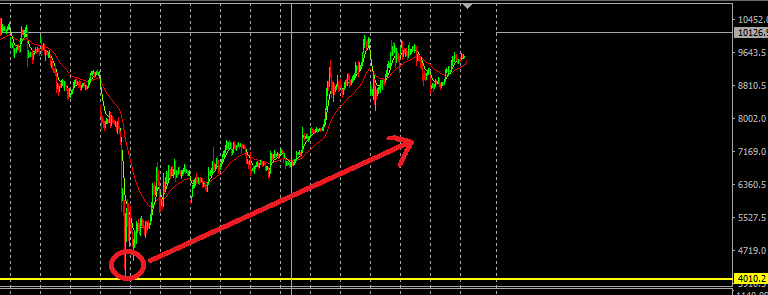
If you have been following bitcoin recently, then you would have noticed that prices have been consolidating for a while now after making a massive impulsive move from the $4000 lows experienced earlier on the 13th of March 2020.

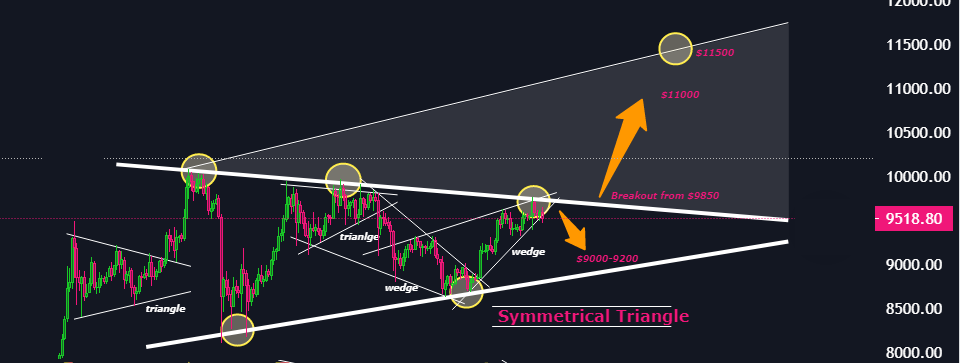
This massive rally took the Bitcoin price to the $10k mark where it has found resistance and consolidated ever since between the 10168 resistance zone and the 8500 support zone, gradually forming a symmetrical triangle pattern.
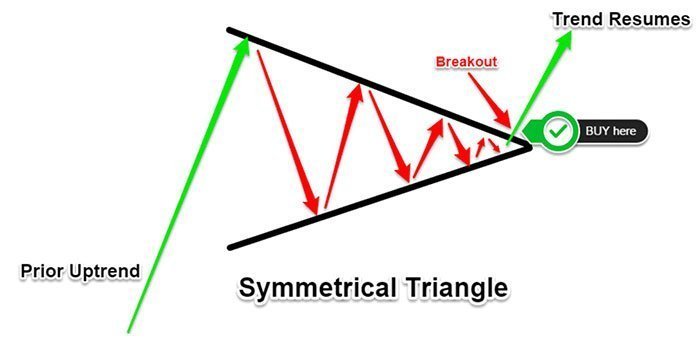
This symmetrical triangle pattern is very important to traders as it is typically a trend continuation pattern that supports the idea that the bitcoin bull run is not over yet, and we might see a further rallying of the bitcoin prices above the $10k mark. In this bitcoin analysis, I will be highlighting what I will be looking for prices to do, the important levels to look out for, and my targets for a potential upside move.
How to Trade the Symmetrical Triangle

A symmetrical triangle is a 5-leg retracement pattern usually formed during a period of market consolidation. This pattern is a sideways movement that provides you the time to position yourself properly to rejoin the trend.
For bitcoin prices have developed only 4-legs of this retracement pattern, meaning that the breakout setup is yet to be complete and we might likely see a retracement back down to the $9000 region before prices finally begin to push up.

Important Levels to Look Out For
There are two important levels to look out for in bitcoin right now, one of them is the 8500 resistance zone. This zone is very important as we have seen prices bounce off this zone week after week throughout this sideways retracement. A break below that support zone could potentially see prices decline even lower towards $6,540.

The second critical level to look out for is the top/resistance of the symmetrical triangle between $9,080 to $10,507. A break above this level could see the bulls pushing prices into $11k or more.
Calculating The Potential Targets for The Upside Move
Even as prices continue to converge in the symmetrical triangle, I expect prices to break out to the upside in the coming weeks. For my target, I believe BTC as the potential of getting as high as $11,230.

But with that being said, it is also important to note a very important horizontal resistance that might become a little difficult to break during this up move.

The 10318 resistance is a very important resistance that has come into play numerous times in the past with prices bouncing off it and failing to breakthrough. A similar occurrence might take place for the symmetrical triangle breakout and requires you to be cautious because if prices fail to break out, then might see prices begin to sell-off.


