

As predicted in our previous Bitcoin analysis Bitcoin $51,381 Resistance Held. Is This A Bearish Sign? the Bitcoin bearish price scenario just played out completely. And right now, we are seeing more bearish pressure build up on the Bitcoin chart.

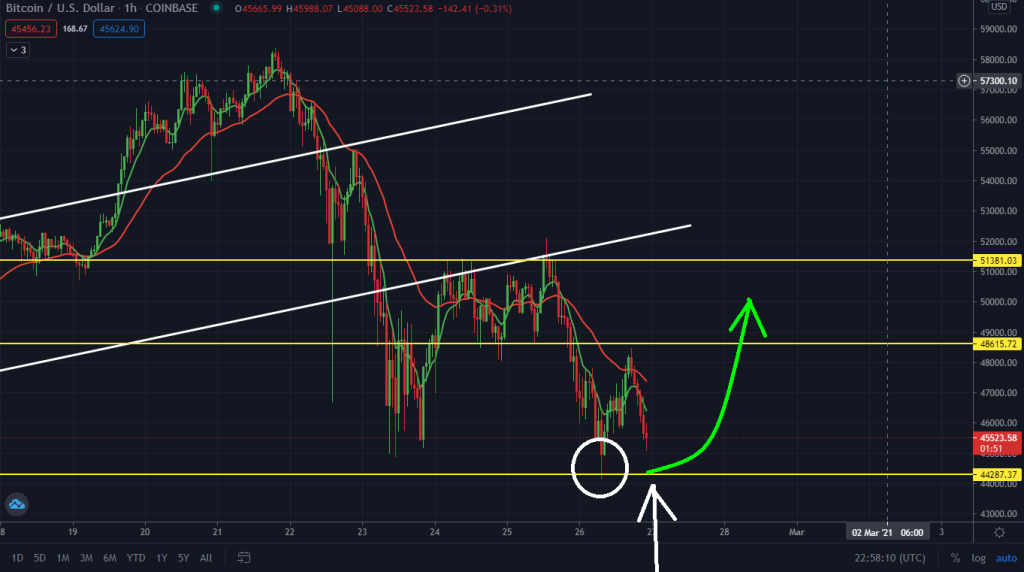
In this Bitcoin analysis, we will be talking about the $44,287 support region and how it can play a critical role in the Bitcoin price in the coming days.
You can take advantage of these Bitcoin trade setups on Bybit. The platform is fantastic for both beginners and experienced traders.
You also get up to $200 in bonus when you signup and deposit using our Bybit link.
More Selling Pressure?

The bearish pressure on Bitcoin is building up really fast after the Bitcoin price just retested and failed to break through the $48,615 previous support now turned resistance.
This signifies that sellers are pilling up into the crypto space and we might see a larger Bitcoin correction play out in the coming days. But for this bearish scenario to play out, we must see a clean break and close below the $48,615 support region.

A break below this support will signify another win for the bears and could lead to a steeper decline in the Bitcoin price in the coming days.
However, if the Bulls can manage to hold that price region, then there is a very high probability that we might see a bounce and a rally in the Bitcoin price soon.
To take advantage of this Bitcoin trade setup, you can sign up using this link to get up to $200 after your first deposit.
We also created a video below where we talked more in-depth about the patterns developing on the Bitcoin chat as well as key fundamental factors that might affect the Bitcoin price in the coming days.
To gain more information on how to partake in this coming Bitcoin Bull run and trade this cryptocurrency, you can read my How To Trade Bitcoin Guide. You can also check my top list of Best Bitcoin Exchanges To Trade With


