

- HBAR has shifted from bearish to bullish on M30, breaking structure after grabbing liquidity
- A fresh demand zone below liquidity could trigger a bounce—watch for confirmation
- No 100% certainty in trading—always wait for structure shifts on lower timeframes
Hedera (HBAR) has been showing some intriguing price action lately.
In our previous analysis, the structure was clearly bearish on the 30-minute timeframe (M30).

However, things took an interesting turn after liquidity was taken—HBAR then broke structure to the upside.
HBAR Market Structure Shift: Bullish or Not?
If we consider the candle wicks as part of the structure break, then M30 could now be seen as bullish.
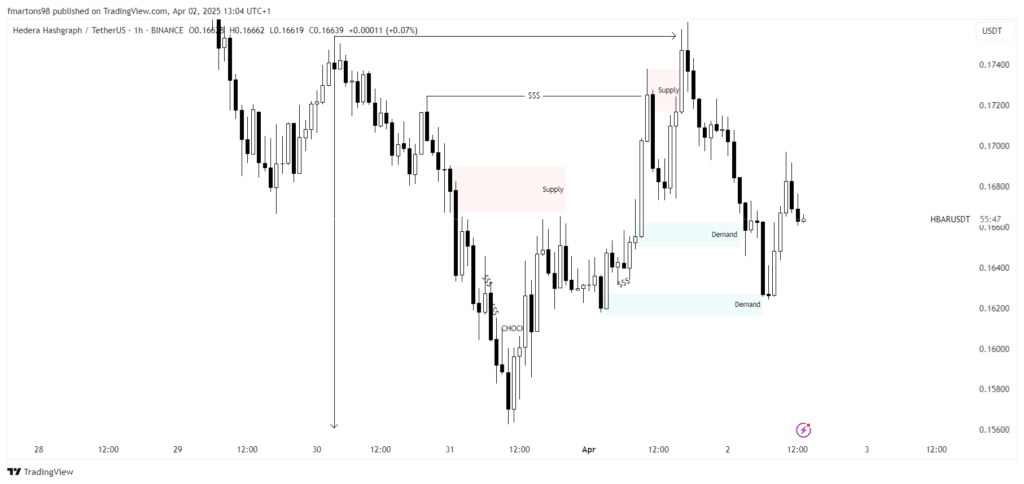
But as always, price action isn’t that simple. We previously identified two key demand zones below.

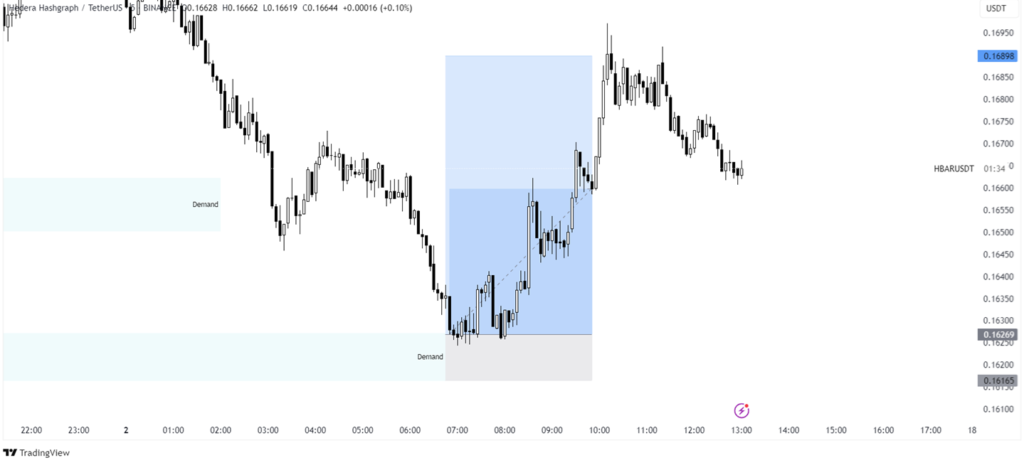
The deeper demand zone was particularly interesting because there was liquidity nearby.
And guess what?
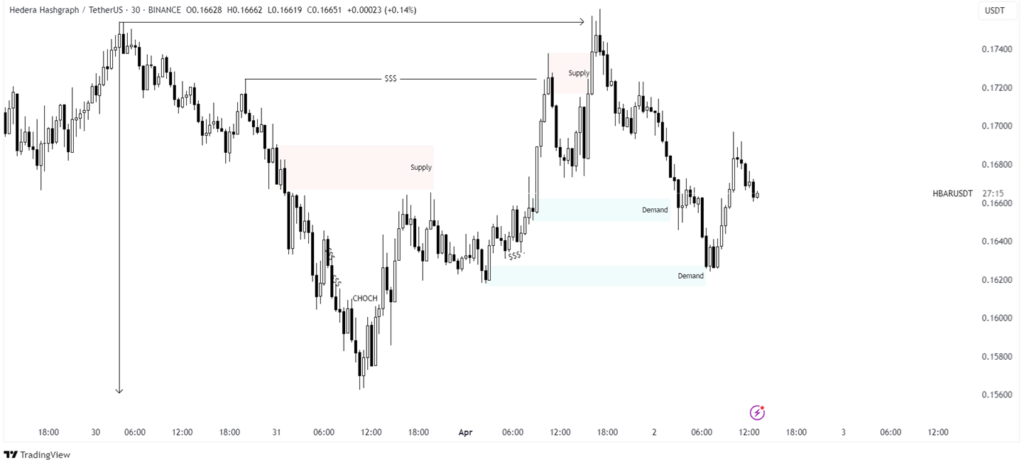
The price reacted perfectly to that demand, bouncing with a 1:6 risk-reward reaction—a strong confirmation of the level’s importance.
Liquidity, Demand Zones & the Next Move
Now, there’s another M30 demand zone below fresh liquidity, making it an interesting area to watch.
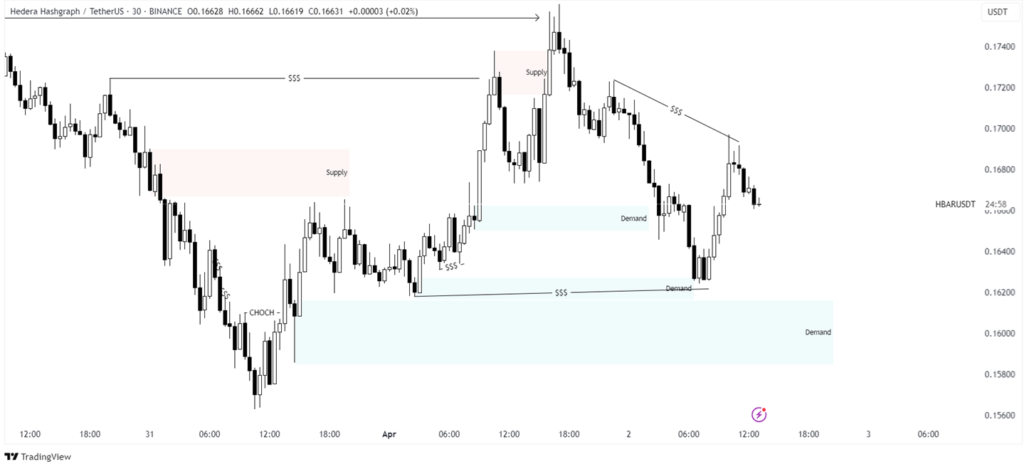
If price taps into this zone and we see a shift in lower timeframes, a long setup could present itself.
But let’s be real—there’s no 100% certainty in trading. Price could completely ignore these zones and do whatever it wants. That’s why we focus on probability, not prediction.
Psychology & Trading Strategy: Why Colors Matter
Ever noticed how stop-loss levels are usually marked in red, while take-profits are in green?
That simple color scheme messes with traders’ psychology. A stop-loss isn’t a failure; it’s part of a strategy. No one wins 100% of their trades, and if someone claims they do, run the other way.
So next time you see stop-losses marked in red, remember—it’s just part of the game.
Final Thoughts: What’s Next for HBAR?
- The M30 structure looks bullish if we count wicks.
- A fresh demand zone below liquidity could be the next key level.
- Trading is all about probability—watch for confirmation on lower timeframes before making a move.
Let’s see how the market plays out!


