Table of Contents

In our previous Bitcoin analysis BTC Ranging Right Now! What Next? we talked about the bearish targets for the converging triangle breakout we saw happen in the 4-hour timeframe. That bearish price prediction has been playing out exactly. However, Bitcoin has found support and is rallying right now!
In this Bitcoin analysis, we will be talking about the larger pattern this current rally in the Bitcoin price forms.
Watch This Channel!

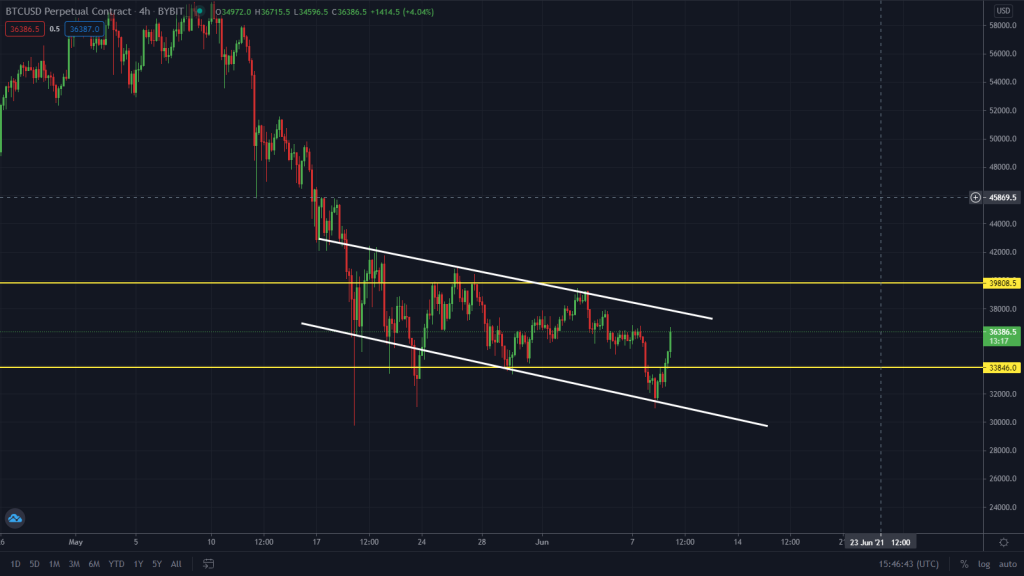
The Bitcoin price is currently trading within this descending channel on the 4-hour timeframe. That means this current rally in the Bitcoin price might encounter strong resistance at the top channel.

If the price is unable to break above this top channel, there is a very high probability that the Bitcoin crash might just continue.
Key Resistance!

We are still keeping the $39,808 level as the key resistance for this bearish trend in Bitcoin. As far as Bitcoin continues to trade under this horizontal resistance, we will look for only shorting opportunities in the Bitcoin market.
Final Verdict!

This current rally in the Bitcoin price does in no way signify the end of the bearish trend. We will remain bearish until the $39,808 horizontal resistance gives way.
Also, there is a very high probability that Bitcoin might find resistance at the top of the descending channel and start selling off back. If this price scenario works, these levels would be the best places to look for short-term sell trades back down to the downside.

Related Articles: Full Guide On How To Short Bitcoin
For More Trading Ideas
For more trading ideas, watch our short Youtube video where we broke down this unique pattern forming on the Bitcoin and Ethereum price chart.


