

- XRP followed classic PO3 phases—accumulation, manipulation, and distribution—to achieve its new all-time high
- With no historical price references, XRP’s future moves depend on key demand, liquidity, and supply zones
- Patience is key: Wait for XRP to approach critical levels before making trading decisions
XRP created a 7-year high amidst Ripple’s ongoing battles with the SEC. Read more about Ripple’s legal challenges and market performance here.
But what happened before this breakthrough? If you’ve been keeping an eye on the charts, you might have noticed XRP perfectly executing the three phases of PO3: accumulation, manipulation, and distribution.
Let’s dive into this step-by-step journey and what it might tell us about XRP’s next move.
Accumulation, Manipulation, and Distribution: How XRP Played Retail Traders
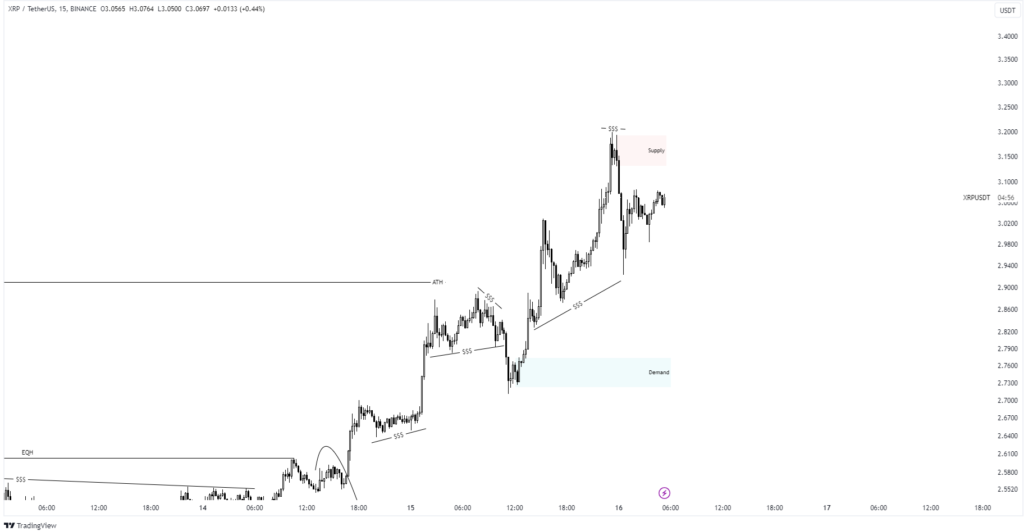
Before reaching its ATH, XRP showcased textbook market behavior.
It started by creating liquidity below the price—drawing in bearish traders who believed the structure was heading south. And just when retail traders started stacking short positions, boom! XRP grabbed that liquidity below and turned the tables, heading upwards to claim the liquidity above.

Here’s what I said yesterday about this setup:
“If liquidity is left both above and below, I’d wait for a liquidity grab below before expecting an ATH breakout.”
And XRP delivered exactly that. It faked out the bears, swept liquidity below, and launched upwards to grab the liquidity resting above.
This manipulation phase—classic PO3 behavior—cleared the path for the breakout.
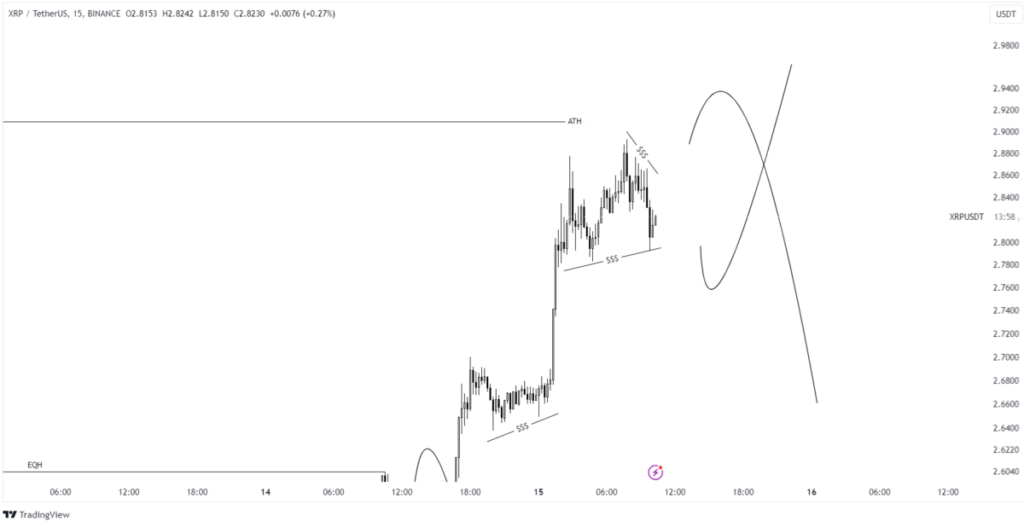
Now What? XRP Has No Historical Points to Reference
With the ATH established, XRP has entered a zone with no historical price reference. Predicting its next move has become trickier than usual. So where does that leave us?
The current chart reveals three key zones:
- A demand zone below – This area represents strong buying interest and could act as a springboard for future moves.
- Significant liquidity above – This pool of liquidity is likely to attract price action as XRP seeks to grab it.
- Supply zones overhead – These are areas where sellers may step in, potentially causing a short-term pullback.
Can We Be 100% Sure?
Absolutely not. The market moves how it wants, and no amount of analysis can guarantee what happens next. The scenarios I’ve outlined are possible but far from certain. XRP could defy expectations yet again and make an unpredictable move.
Final Thoughts
XRP has proven its ability to execute calculated moves, perfectly following the PO3 phases to hit a new ATH. While the next steps might seem uncertain, the current chart gives us clear zones to watch—demand below, liquidity above, and supply overhead.
If you’re trading XRP, patience is key. Wait for the price to reach your zones of interest before making a move. And remember: the market’s unpredictability is what makes it exciting.
Disclaimer: The information provided in this article is for informational and educational purposes only and does not constitute financial, investment, or trading advice. Any actions you take based on the information provided are solely at your own risk. We are not responsible for any financial losses, damages, or consequences resulting from your use of this content. Always conduct your own research and consult a qualified financial advisor before making any investment decisions.


